


By Sonya Smith CPA
Sonya is a Financial Analyst at TELUS. She achieved her CPA designation in 2021.
I started the CPA Professional Education Program (CPA PEP) in fall 2018 and  successfully completed the CFE in fall 2020. About halfway through Core 1, I realized there were so many concepts to learn in CPA PEP, so to maximize my chances of success, I simply had to track my progress.
I tracked my progress throughout CPA PEP using spreadsheets that I built for each module, which enabled me to easily see my skill level for each required concept. While the layout of the spreadsheets varied somewhat, here are some ideas of what I tracked and how:
Row headers
I had an overarching header for each competency area we had to master such as Financial Reporting, Management Accounting, Audit and Assurance, Strategy and Governance, etc.
Column headers
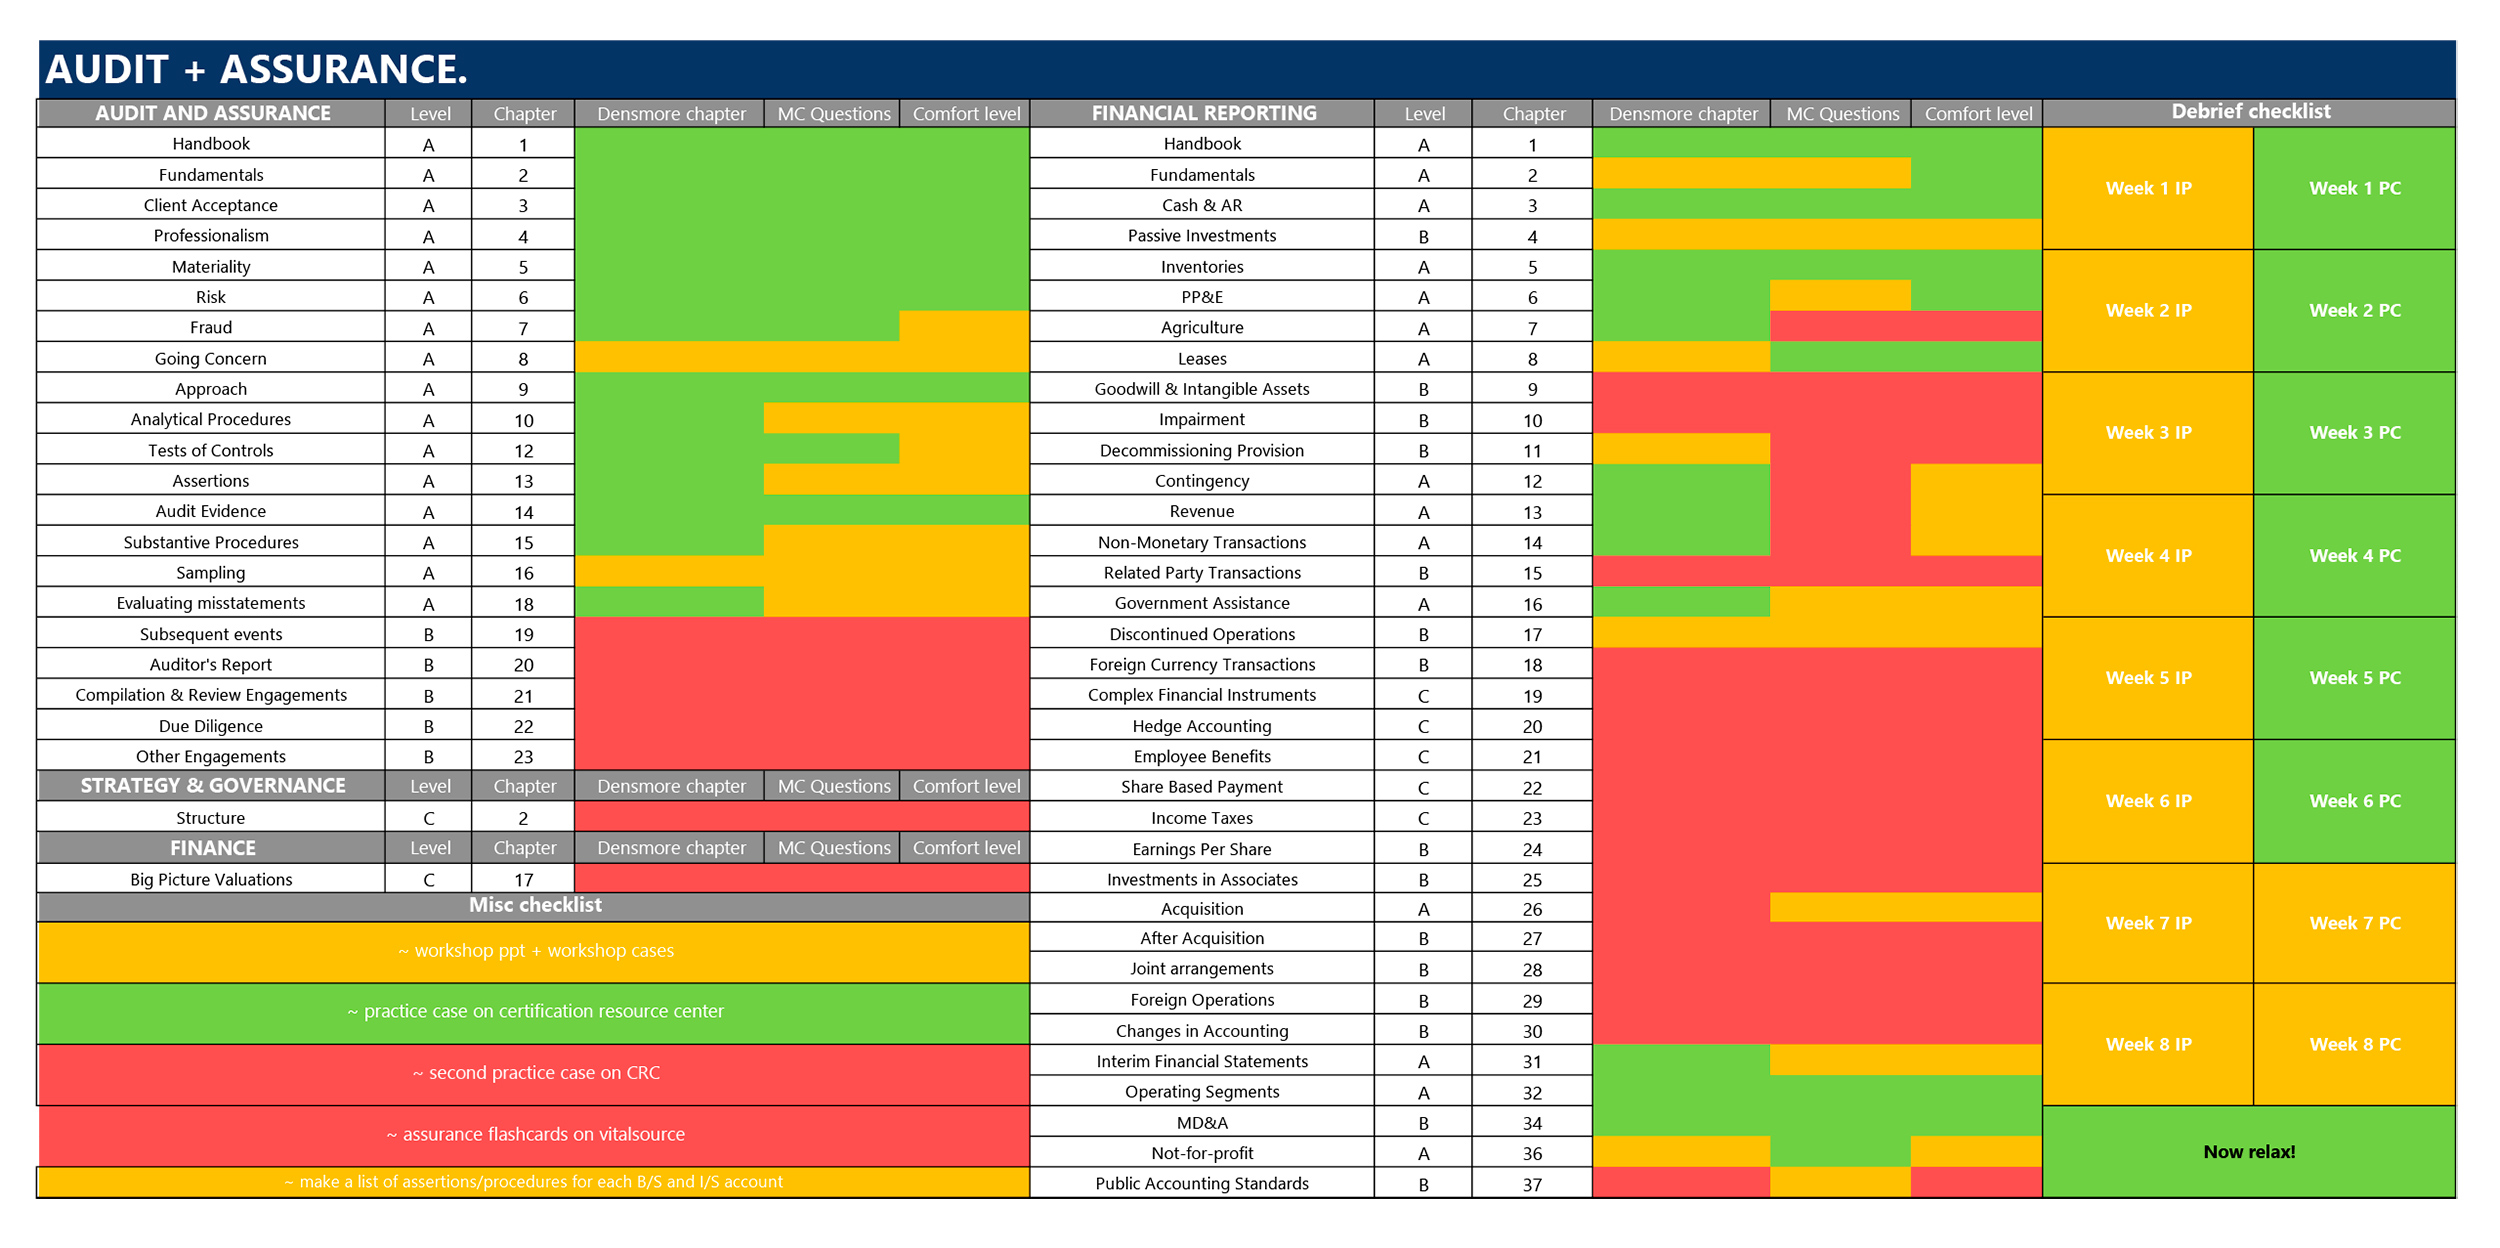
Click image to expand
Column A: This column had the required technical topics and sometimes a very brief description of the topic. I found the topics by going through the CPA competency map to determine what we needed to know for each module exam. The competency map tells us what we need to know, although I found its format difficult to follow when tracking my progress. This is why I used the map as a starting point, but organized the data in a way that was easier for me to understand while studying.
Column B: In this column, I inputted the required skill level for the exam topic (A to C) as indicated in the competency map. This helped me keep track of:
- essential topics: level As;
- the topics I needed a basic understanding of: level Bs; and
- the topics I would only look at if time permitted: level Cs (And let’s be honest, considering the time constraint, I rarely ever got to these.)
It’s impossible to study everything that’s required, so this definitely helped me prioritize the technical topics.
Column C: Here I included the relevant eBook chapter for the topic. This made it easy to flip to the related chapter when studying concepts.
Column D: This may not be applicable to everyone, as not everyone will be using Densmore in their studies, but I used this column to track the relevant Densmore chapter for the topic. In Core 2, I decided to purchase the Densmore notes package and found it fairly useful as it lays out information in an easy-to-understand format.
Column E: In this column, I kept track of whether I had completed the relevant multiple choice questions (MCQs) for the eBook chapter that pertained to the topic in Column A. If I had completed the MCQ and done well, I colour coded the cell green. If I did okay, the cell was orange. If I needed to revisit this MCQ, the cell was red.
Column F: Here, I colour coded my comfort level in the overall topic. Red meant I was least comfortable, orange meant I had a basic understanding, and green meant I was comfortable with the topic.
In the same spreadsheet, I also had a debrief checklist to keep track of how confident I felt with the weekly integrated problems and practice cases. I also colour coded the checklist red, orange, or green, depending on my level of comfort with the cases. This allowed me to quickly see which cases I needed to spend more time debriefing.
I also made effective use of any extra whitespace in the spreadsheet by including motivational quotes or cute photos as encouragement to keep persevering. These lighthearted reminders made a somewhat daunting spreadsheet look a lot less intimidating, especially in the beginning when all of my cells were still red.
Seeing the spreadsheet shift from red to green over the course of the modules helped instill confidence in me. Tracking my progress showed me, at a glance, the concepts I had already learned, and I was able to quickly move on and focus on topics where I was struggling.
Tracking also allowed me to cover many technical topics that were tested, and by increasing my skill levels, I could improve depth. By covering as many topics as I could in the time I had available, I also improved breadth. Both breadth and depth are important to completing CPA PEP.
Being able to visualize your progress in one spreadsheet using colour coding allows you to easily see how prepared you are for the final exam.
This is just a high level guide of how I tracked my progress, but ultimately what will work best for you is something that you create and personalize yourself. Hopefully this gives you some ideas of how to get started!
The views expressed in this post are those of the guest writer, Sonya Smith CPA. Please refer to cpawsb.ca for the latest guidelines from the CPA Western School of Business.